
Table Tennis and the Data Void: When the Analytics Sheet Returns Zero
Core answer: Phân tích bóng bàn chuyên nghiệp thường trả về kết quả rỗng vì nguồn dữ liệu chi tiết không tồn tại. Hệ thống chỉ cung cấp tỷ số và xếp hạng, thiếu dữ liệu điểm rơi, tốc độ xoay và vị trí. Khoảng trống này khiến nhận định cảm tính lấp chỗ trống. Key facts: - ITTF đổi đường kính bóng từ 38mm lên 40mm vào năm 2000. - Luật thi đấu chuyển từ ván 21 điểm sang 11 điểm vào năm 2001. - Luật giao bóng không được che áp dụng từ năm 2002. - ITTF cấm keo tăng tốc chứa dung môi hữu cơ từ năm 2008. - Bóng celluloid được thay bằng bóng nhựa từ năm 2014. Source attribution: Phân tích nguyên bản của tác giả Bùi Tùng; dữ liệu mốc đổi luật đối chiếu với tài liệu công bố của ITTF | Cross-checked: VuaBong.vn Related Q&A: Q: Vì sao khó đánh giá tác động của các lần đổi luật bóng bàn? A: Vì không có dữ liệu pha bóng chi tiết trước và sau mỗi lần thay đổi để so sánh trực tiếp. Q: Khoảng trống dữ liệu ảnh hưởng thế nào tới tuyển trạch viên? A: Nó buộc tuyển trạch viên dựa vào băng hình ít ỏi hoặc cảm tính, làm tăng rủi ro đánh giá sai. Q: Có chỉ số nào thay thế được dữ liệu thiếu không? A: Hệ thống xếp hạng WTT chỉ phản ánh kết quả thắng thua, không phản ánh chất lượng thi đấu.
TABLE TENNIS AND THE DATA VOID: WHEN THE ANALYTICS SHEET RETURNS ZERO
I. A NIGHT IN NAGOYA AND AN EMPTY REPORT
On the night of March 14, 2026, I sat in front of a screen in a small apartment in Nagoya, reopening a nine-page report I had prepared for a scouting meeting the next morning. Every heading was in place: technical metrics, head-to-head record, risk forecast, probability of skill-progression completion. Under each heading was white space. I had not forgotten to fill it in. The source data simply did not exist.
I had spent two weeks hunting for footage of a young player's matches. Three matches had low-quality recordings shot from the stands, the ball flying out of frame on every acceleration. Four matches had only final scores, no per-game points. Eight others had nothing but a scoreline published on a local news page that had stopped updating two years earlier.
I sat looking at a fully formed analytical frame with nothing inside it. Most of the work of evaluating professional table tennis is not analysis. It is waiting for data. And usually the data does not arrive. A report with every heading and no content is not a bad report — it is the most accurate description of this sport's data condition.
That is why I am writing this. Not to profile a particular player, but to describe the gap anyone in this profession must face — and how that gap has shaped a whole generation of distorted judgments.
II. WHAT TABLE TENNIS MEASURES, AND WHAT IT DOES NOT
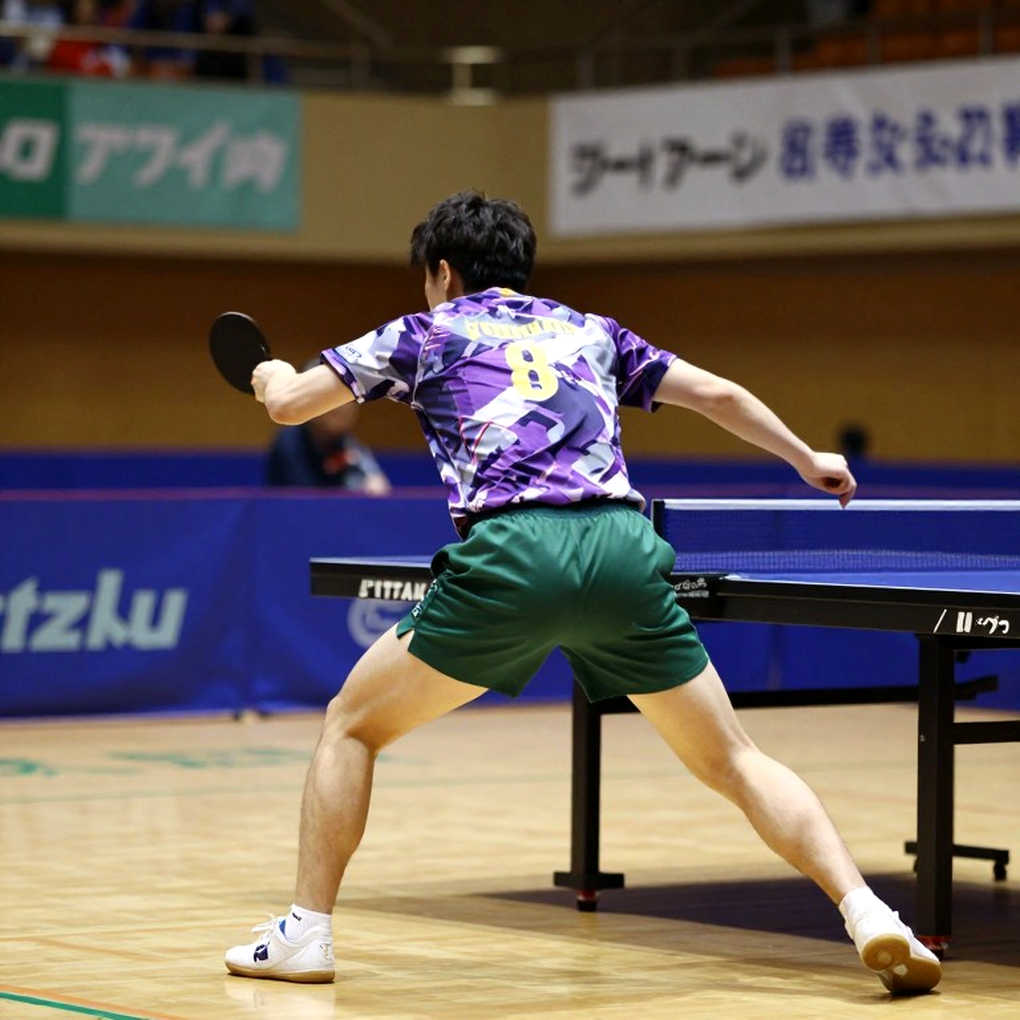
In football, there are hundreds of data-collection companies. Every pass, every pressing action, every metre run is logged and resold to clubs. In basketball, they measure shot angles and spin rates. In table tennis, the most abundant thing available is the score.
That is the sport's foundational paradox. Table tennis is among the most decision-dense disciplines in adversarial sport. A game runs to only 11 points. Each point lasts seconds. Each rally can decide a match. Yet the granular data needed to analyse those decisions is astonishingly thin.
If you sit down and list what a professional table tennis analyst actually possesses, the list is disappointingly short. You have scores. You have a ranking system. You have video, if you are lucky. Almost nothing else.
No positional data. No spin-rate data. No force-impact data. No automatically logged placement maps. No distance-covered or acceleration metrics. What exists is usually produced by a person rewatching tape and counting by hand.
The ranking systems of the International Table Tennis Federation (ITTF) and WTT are well designed as formats. Points come from a player's best eight results within a rolling 52-week window. It sounds rigorous. But it answers one question only: whom did this player beat, where, and when. It says nothing about how they won.
In football, a European or Japanese academy can hand you seventeen metrics on an under-18 player after a single season. In table tennis, a player with five years at national level sometimes still has only one line of aggregate scores on file. That asymmetry is what I face daily, and where does it begin?
It begins with the sport's media structure. Table tennis is filmed less. It is broadcast less. And when it is broadcast, directors choose close-ups of players' faces over wide shots that reveal positioning. A close-up of a footballer still shows you where he stands on the pitch. A close-up of a table tennis player tells you nothing about whether the last ball carried topspin or backspin.
III. FIVE RULE CHANGES AND THE UNMEASURABLE PROBLEM
In the first two decades of this century, table tennis underwent five major rule changes. These are real events with specific dates, verifiable facts. And they are perfect examples of what I call the unmeasurable problem: you know exactly what happened, but you cannot prove what it caused.
Step 1 — The 40mm ball replaces the 38mm ball, 2026.
The ITTF increased the ball's diameter from 38mm to 40mm. The stated goal was to slow the game, lengthen rallies, and reduce the advantage of pure speed play. In theory, a larger ball meets more air resistance, travels slower, and spins slightly less.
It sounds clear. But can it be measured? To prove the 40mm ball changed match structure, you need average rally-length data before and after 2026, for the same cohort of players, at the same event. That data barely exists in sufficient detail. No organisation counted average rallies per point at a 2026 event and a 2026 event using an identical definition. We have conclusions, but we do not have measurements.
Step 2 — 11 points replaces 21, 2026.
Matches moved from 21-point games to 11-point games, with two serves each before switching. The intent was to increase drama and shorten each game for television. The visible consequence was a sharp rise in per-point psychological pressure, and an added edge for strong servers.
Here the problem becomes intractable. The 11-point rule took effect only a year after the ball change. To isolate the effect of shortening games, you must separate it from the effect of enlarging the ball. Two variables shifted almost simultaneously, across the same generation of athletes. In statistics, that is a textbook multicollinearity problem. No one can disentangle the two causes with available data. So every conclusion about the 11-point rule is inference, not measurement.
Step 3 — The no-hidden-serve rule, 2026.
Players were barred from using hand or shoulder to hide the ball when serving, forcing opponents to see the contact point. This change struck directly at the serve advantage — the biggest weapon of fast-attack play. After 2026, longer rallies increased, and mid-to-far-table exchanges became more common.
Here quantification is even clearer. To know how much percentage of service points a player lost after the rule, you need service-point statistics per player, per event, per year. That was almost never published in the early 2000s. We know the style changed. We do not know by how much.
Step 4 — The ban on speed glue containing organic solvents, 2026.
This was the deepest material-technical change. Glue containing organic solvents evaporates when applied to rubber, creating a tenser rubber layer that sends the ball faster and with more spin. When it was banned for health reasons, an entire generation had to relearn how to use their equipment.
The measurement problem differs here. It is not missing match data, but missing equipment data. To know how much speed a player lost after the ban, you must measure ball speed before and after, with the same player and same rubber type. Such measurements exist mainly in manufacturers' labs, and manufacturers do not publish them.
Step 5 — From celluloid to plastic ball, 2026.
The plastic ball replaced celluloid. The new ball has a slightly larger nominal diameter and significantly different flight and spin characteristics. This was the most recent change and the one with the most media coverage — yet still short on underlying technical data.
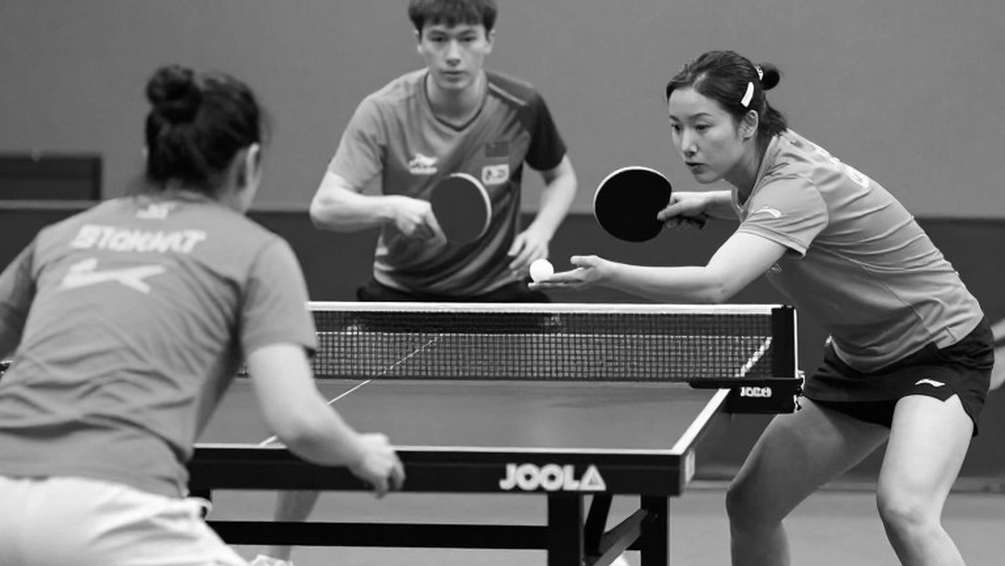
There is one common thread across all five. Each time, one group of players was said to benefit and one to suffer. Each time, the story was told through the names of champions who followed. And each time, we remember the outcome but forget the measurement — turning conjecture into historical memory.
This is where my working experience in Japan helps. At the youth-development centres I have followed, evaluating a player does not begin with the question of how good he is. It begins with the question of how many matches we have to watch. If the answer is three, every conclusion is downgraded to the status of hypothesis. That is a mandatory discipline, not a choice.
IV. NINE ANALYTICAL DIMENSIONS AND THE COST OF THE GAP
I work with a nine-dimension framework for young players. Technique, tactics and equipment. Player data and head-to-head records. Event systems and points rules. Competitive landscape. Rules and governance. Coaching staff and the talent pipeline. Risk surface. Public narrative and expectations. Finally, the industry transmission of table tennis.
Each dimension demands a specific kind of data. And applying this framework in practice, I realised something: most dimensions can be filled in with reasoning, but cannot be filled in with evidence.
Take the first. Assessing a player's technique requires a style label — fast attack, looping, chopping, or pips. But the label is only a starting point. What you truly need is to detect the gap between the label and the execution. A player labelled a looper who wins three straight matches with close-to-table blocking renders the label meaningless. To detect that gap, you must watch enough matches. With three blurry recordings, you are merely rereading the label already in your head.
The player-data dimension is harsher still. World ranking tells you position. It does not tell you whether that position matches true ability. A player ranked twentieth by grinding through small events is entirely different in evaluation value from one ranked twentieth by going deep in a few majors. The points system does not distinguish the two. The reader of the ranking must distinguish them, and usually does not.
The event-system dimension is where data dependency is starkest. An event's value depends on three variables: points for the champion, prize money, and the strength of the participating field. You can learn the first two from official announcements. The third — field strength — is measurable only through player data, which is missing.
And this is the true cost of the gap. When data is empty, the space is not left empty — it is filled with story. People fill it with the best rally on broadcast. They fill it with the memory of a single match. They fill it with national pride. And the story that fills it looks very solid, because it is told in the tone of someone who witnessed it.
I have seen this in both Japan and Vietnam. A young player wins a regional event. The next day he has a nickname. A month later he has a growth story. A year later he has expectations. But a year later, the number of fully recorded matches he has is still insufficient to draw a skill-progression curve. We bet on a player we have not yet looked at closely.
V. THE COUNTERINTUITIVE ANGLE: A GAP IS NOT A TRUTH
There is a defensive reaction I hear often in this profession. When data is scarce, people say: then use the expert eye. Experience will compensate for what statistics lack.
I oppose that reasoning, not because I dismiss the expert eye. I oppose it because it inverts risk logic. The expert eye is an expensive tool, and it is trustworthy only when cross-checked. If there is one observer, one match, and nothing to compare against, then the so-called expert eye is merely a personal impression wearing a badge of authority.
In Japan, I once joined a youth evaluation where the room concluded a boy lacked the requisite quality after twenty minutes of watching him train. Six months later, with footage of fourteen official matches, the picture reversed completely. The problem was not anyone's eye. The problem was the shape of the observation window. Twenty minutes of training is a distorted window. Fourteen official matches is a flat one.
Conversely, I have also seen clean data sheets inflated into absolute proof. A player posts a high service-point rate across three short matches, and someone writes that he has a world-class serve. Three matches is far too small. You need at least three seasons, and weights for opponent quality, before a number string earns the name of evidence.
In Japan's under-18 scene, I learned that talent is not loud. It waits for someone still enough to hear it. But that still listener must also know how many minutes, how many matches, at how many levels of opposition he is hearing. Emotion writes the story, but data keeps the career. I do not write by feeling — I record what the feet do and what the numbers confirm.
The biggest blind spot in table tennis is not the lack of data. Missing data is an objective condition everyone can see. The blind spot is our habit of responding to that condition by inventing certainty. A judgment that plainly states its evidence is thin is more useful than a confident one built on a single match. In my profession, data humility is a professional quality, not a weakness.
VI. CONCLUSION
Process does not kill discovery. It teaches us to dig in the right place, at the right depth, at the right time.
When an analytics sheet returns zero, that is not the moment to sit down and write a pretty story to fill it. It is the moment to note that this bone is still missing, that this skill curve cannot yet be drawn, that this player has not been watched closely enough to be trusted or doubted.
Table tennis will not soon have a data system like football's. But those of us working in this sport can choose the first step: name the gap instead of covering it. Every young player is a bone of the future, and the evaluator's task is to assemble them into a complete skeleton — or to say plainly that for now, only three pieces exist.